Intercepts and Asymptotes and Holes, Oh My!
February 20, 2017
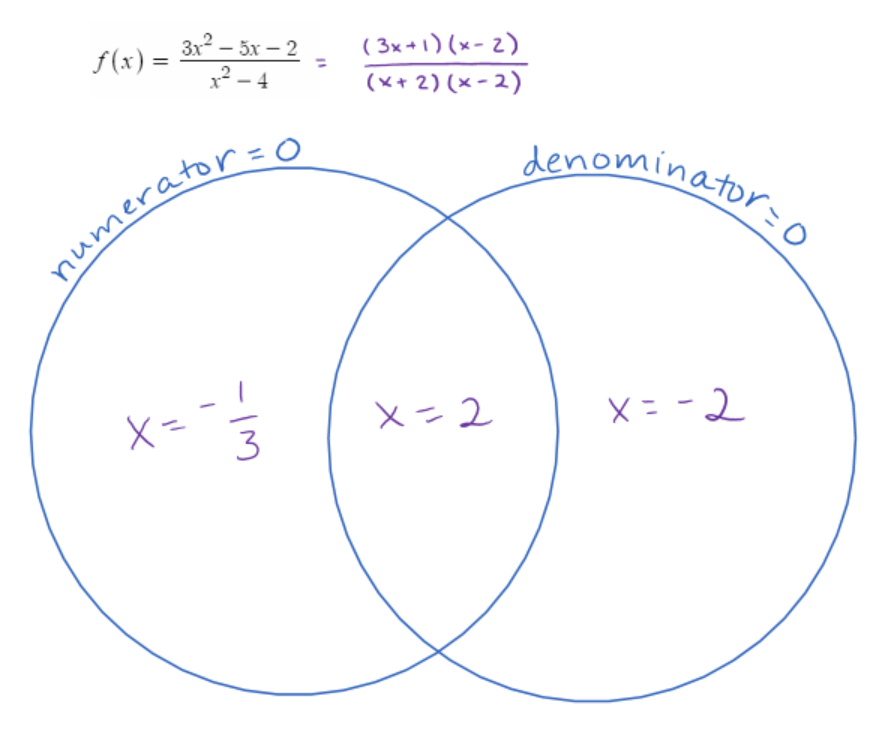
I’ve been teaching for 27 years. This morning during a discussion of rational functions in a precalculus class, I had one of those why-didn’t-I-think-of this-years-ago moments, when I found myself drawing a Venn diagram on the board in response to massive confusion about holes.
My hypothesis about why the analysis of rational functions can feel so overwhelming to beginners is that brains of novices want to do things like lump together x- and y-intercepts and lump together horizontal and vertical asymptotes. When it comes to identifying the various features of a a rational function, however, the work that one must do to find x-intercepts, vertical asymptotes, and holes is all of a kind, whereas the work required to identify horizontal asymptotes, or even y-intercepts, is quite different. (What Daniel Willingham has to say about inflexible knowledge being tied to the surface structure of a problem is likely relevant here.)
We teachers can be particularly helpful to students if (1) we are attentive to places where students are likely to miss deep structure because of a strong natural tendency to focus on surface similarities and (2) we can find ways to help students organize thinking around deep structures instead. What I think the Venn diagram that occurred to me today did was to focus student attention on the closely related ideas that
- knowing the values of x which will make the numerator and/or denominator, zero is really important
- it matters a lot whether it’s the numerator or denominator or both that is/are equal to zero
It was easy for students to organize information into the Venn diagram and once that was done, they had no trouble sorting out which values of x would produce intercepts and which would produce asymptotes, and they were well on their way to puzzling through why holes occur.
Following this, I used Desmos to provide students with both the graph and the equation of a rational function with lots going on and asked them find one or more things they thought they could explain about the graph based on the equation. This was the function we thought about:
f(x)=\dfrac{(2x^2-18)(x+5)}{4x^3-100x}
This generated lots of questions that students did very productive struggling with in pairs. I overheard things like “Wait–how come there isn’t an intercept at x = -5?”Or “How come there isn’t a vertical asymptote of x = -5?” and saw light bulbs going off as students realized the answers for themselves.
I think in future years I am likely to use a graph and equation combination like this as a starting point for the topic of analyzing rational functions (see Nancy Kress’s post on using a prompt–rather than a problem–as an entire lesson plan). Once students have done lots of noticing, wondering, and exploring, the Venn diagram should be helpful as a means of summarizing a lot of what they have discovered into a memorable picture that is helpfully connected to deep structure.
(A few years ago, a student had an insight that has changed the way I’ve talked about horizontal asymptotes of rational functions. You can read about that here.)