Lines behaving oddly: Discovering log rules
April 3, 2013
I introduced log rules in a novel way in my precalculus class today. As a bit of important background, the idea of logs was not new to these students. We’d done extensive work with logs back in the fall when we were focused on learning about a variety of fundamental functions. At that time, we did a lot of work with changing equations from log form to exponential form, graphing log functions and developing an understanding of the inverse relationship between log functions and exponential functions. I skipped, however, the section on log rules, figuring both that the rules would be more approachable once students had time to become more comfortable with logs and that leaving the rules for later would provide a good opportunity to practice logs again after some time away. (Truth be told, I’m sure that every one of these students had seen the log rules in an Algebra 2 course, but my experience is that these rules are not at all well remembered after time away from them.)
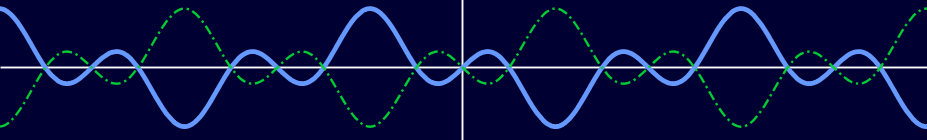
Anyway, today I began class by opening a Desmos sketch and saying only, “Ask some questions about this.”
Even before I started moving the sliders the questions and observations began. I said nothing. Then I moved the p slider a bit. More questions and observations. I still said nothing. After a minute or so, I moved the q slider a bit. I wasn’t prepared for the gasp of amazement that came out as I began to move the q slider, but it certainly made it clear that something they hadn’t expected had happened and the questions and observations multiplied, with students reacting to and building off of one another’s ideas. When they asked me to set p or q to a particular value I did. Otherwise, it was all them until we got to a point where I needed to do a bit of calling on people because the observations and questions were coming so quickly that people frequently ended up talking at the same time.
I wish the class had been recorded so I could go back and listen carefully to how the questions and observations developed over the course of the 45-minute period. Students did a great job of coming up with questions to test one another’s ideas about what was going on. The first relationship they established definitively, after perhaps 10 minutes, was that the purple line was the sum of the red and blue lines.
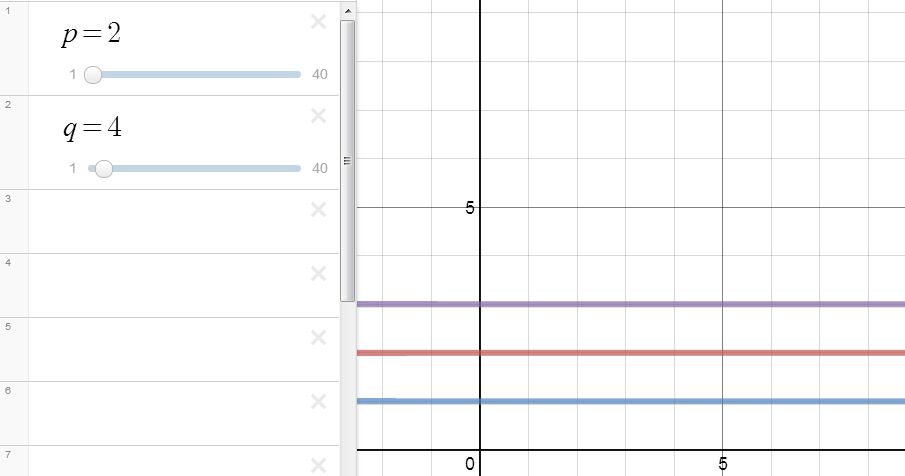
One series of questions that then proved particularly helpful (and it grew out of students hoping to see one or more of the lines move below the x-axis) began with, “What happens if we make p negative?” (I had purposely set the sliders to go in steps of 1 from 1 to 40, hoping that questions like this would arise and when this question came up, I simply adjusted the lower bound on slider p.) Then came the question, “What if q is negative?” Then, “What if they’re both negative?” (Another gasp as I moved both sliders into negative territory.) Before long, this led to a very helpful suggestion from someone that we make tables of values to try to keep track of what happened to all the lines for various combinations of p and q. (The case where both p and q were negative also led some to wonder a bit about how this affected their observation that the purple line was the sum of the red and blue lines since it turned out to be possible for the purple line to exist when neither the red nor blue line did.)
Some of the observations and ideas they started to hone in on turned out to be red herrings, but the pursuit of them made the eventual finding of the rule all the more satisfying. For example, they spent a long time thinking there must be some square root rule for a variety of reasons. I think it first came up because lines disappeared when p or q was negative. Then they realized that p = 4 put the blue line at y = 2, and p = 16 put the blue line at y = 4. And, in what may have been an example of confirmation bias, it took a while for strong proponents of a square root relationship to pay attention to less persistent observers of the fact that the square root of zero exists and the square root of 1 is not 0. They actually ended up having serious doubts as a group about the square root hypothesis when p was set to 9 and its corresponding blue line was just the tiniest bit above y = 3. At first they were thinking it might just be that there was some rounding error somewhere. But once they tried p values of 25 and 36, they were convinced it wasn’t rounding error and abandoned the square root idea.
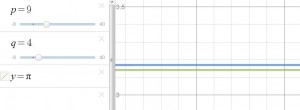
Then, another red herring: maybe that value a little above 3 is actually π! We tested the hypothesis by adding the line y = π to the sketch and, at the original scale of the sketch, the lines appeared to be the same, and students were ready to accept the hypothesis as fact. I took the liberty of zooming in a bit. For the first couple of zooms, things still looked good for the hypothesis, but with a couple more zooms it became clear that the blue line, while it definitely had a height between 3.1 and 3.2, was a bit above the green y = π line.
As soon as that hope was dashed, however, someone pointed out that the values of p and and q for which we’d seen integer values for the associated red or blue line were 4, 8, and 16. And while this raised momentary questions about the possibility of cube root or fourth root relationships, several people at once became strong proponents of a powers of 2 relationship. I asked for suggestions of good candidates for a q value to test this idea. Simultaneously the numbers 32 and 256 were offered as possibilities. I chose 256 and wrote it down in our table, asking for predictions of where this would put the red line and students (even the one who had suggested 256) racked their brains to figure out what power of 2 that was. I ended up not giving them much time to think about it because someone commented that we’d need to zoom out a lot to show the line if we were going to use a number as big as 256 and I wanted to test that idea right away, so I cranked the upper limit on one of the sliders to 256 and slid it all the way to the end. Students who hadn’t been thinking much about what exponent went on 2 to make 256 were surprised by the small increase in the height of the line despite the very large change in p. (Since they’d just completed a project on exponential change, however, I think most realized the error in their intuition once they observed the change.)
At this point, one student shouted out, “It’s logs!” at the same time as another started talking about a way to figure out what the actual line height was for q = 9, the case where the line height was close to π. I focused on the latter since it sounded like this student had an explanation ready. She said we have to think that 2 raised to the line height equals 9. Then, if we take the log base 2 of both sides we get that the line height equals log29. We tried the same graphing a horizontal line test that we had used when we thought the line height might be π. This time, no matter how far we zoomed in, the line y = log29 appeared to be the same as the red line and it seemed clear we were onto something. At least one person made a connection at this point to the fact that we’d seen the red and blue lines disappear not only for negative values of p and q, but also when p or q was zero.
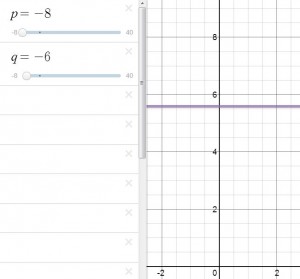
Then the focus shifted to predicting the height of the purple line for various values of p and q and repeated success for positive values of p and q got us to the point where someone volunteered that a rule that described the height of the purple line for positive values of p and q was log2p + log2q. At this point, since we were down to about 10 minutes left in the period, I suggested revealing the rules that Desmos was using to plot the lines, but someone shouted “No! You can’t show us, we don’t have the right thing yet because ours doesn’t work for negatives!” Wow. What more could I ask for? So we began exploring some cases where p and q where both negative and building up a table of values for these, when someone said, “It’s log2(pq).” He said it quietly and someone else called my attention to the fact that she was sure he was on to something and asked him to say it again. We tested his statement for a couple of combinations of negative values of p and q. Students at this point were wise enough to select powers of 2 as initial test vales. I think one combination was -8 and -16. We wrote
\[\log_{2}((-8)(-16))\]
\[\log_{2}((8)(16))\]
\[\log_{2}(2^3 \cdot 2^4)\]
at which point someone announced, “and \(\log_{2}(2^3 \cdot 2^4)\) is \(\log_{2}(2^7)\) because when you multiply like bases you add the exponents so we get 7!” I think that most people at this point had at least a moment of clarity about why “the sum of the logs equals the log of the product.” Paradoxically, by the insistence of a student that we explore cases where we appeared to be trying to take logs of negative numbers, we established that for positive p and q,
\[\log_{2}p+\log_{2}q=\log_{2}(pq)\]
And, in yet another moment of the sort that I am always hoping for, we had hardly finished writing this down when a student asked, “Is there a similar thing when we subtract logs?” and when I asked her what she thought, she replied “I bet it’s division.”
Many different students came up with key observations, questions, and suggestions at different points in the class. Others observed quietly, but most of these observers seemed fully engaged throughout the exploration. It was, in fact, a student who had said little or nothing throughout the rest of the period who realized that the purple line must be defined not by the sum of logs of p and q but by the log of the product. (Ideas, by the way, about the product of p and q being involved in some way had begun to surface with the realization that p and q had to be the same sign for the purple line to exist.)
No one in today’s class asked to see non-integer values of p or q. I’m hoping that will come up when we change the sketch tomorrow to test the subtraction/quotient rule that was proposed at the end of today.
Finally, on a side note, one thing that came up in different ways at different times as students tried to figure out what function of p and q determined the location of the lines was the fact that no matter what crazy functions we might apply to p and q we are going to see horizontal line graphs because the output we get by plugging a particular value into any (single variable) function is going to be some other numerical value, which graphs as a constant function. I’m hoping this might stick with some of them when they get to calculus and have to find the derivative with respect to x of πe or something similar!
Today’s class was further confirmation of my sense that showing something visually interesting and mathematically important without speaking, and asking people to ask questions about it usually makes for a good class and–as my friend and former colleague James Grumbach liked to say–promotes the revealing of material rather than the covering of it.